

Prove what your training is doing – in numbers.
See progress, completions, scores, and survey results across every course — then export the exact report leadership or auditors need. No spreadsheets, no separate analytics tool.






The whole training picture, at a glance.
One dashboard shows who's on track, what's overdue, and how courses perform – by learner, course, session, or survey.
- Learning dashboard – completions, progress, and activity in real time.
- User & course analytics – engagement per person, performance per course.
- Survey & ILT analytics – feedback and live-session participation, together.
Answer "how's compliance tracking?" in one screen.
One report, filtered to the exact answer.
Pull participation and user data for any date range, filtered by course, category, or org unit – 20+ fields per record, from enrollment to score and completion date.
- Advanced filtering – by content, category, and department.
- Any date range – pull a month, a quarter, or a full year.
- Delivered when ready – email and in-app link when the export is built.
"Show me every compliance completion in Sales, last quarter" – one filtered export.
The records auditors and leadership actually ask for.
Export certificates, assessment results, and survey summaries on demand – XLS or CSV for analysis, PDF for a clean summary. Every export ties back to the learner and course.
- Certificate & assessment exports – certificates and test results, ready to hand over.
- Survey summaries – CSV for analysis or a graphical PDF for leadership.
- Custom reports – build and schedule your own report views.
Regulated training? Audit-ready, tamper-proof records and one-click audit export live in Compliance →
Reporting is only as good as the data feeding it.
Insights reads from every part of the platform – authoring, delivery, compliance evidence, and spend – so one dashboard covers the whole training programme.
Course Builder
Quizzes and surveys built in the course feed their scores and results straight into Insights.
Explore Course Builder →Learn
Every completion, ILT session, and blended course reports its activity automatically.
Explore Learn →Compliance
Send certificate and assessment records on to audit-ready, tamper-proof compliance exports.
Explore compliance →Budgeting
Tie completion and participation data to training spend to see cost per learner and course.
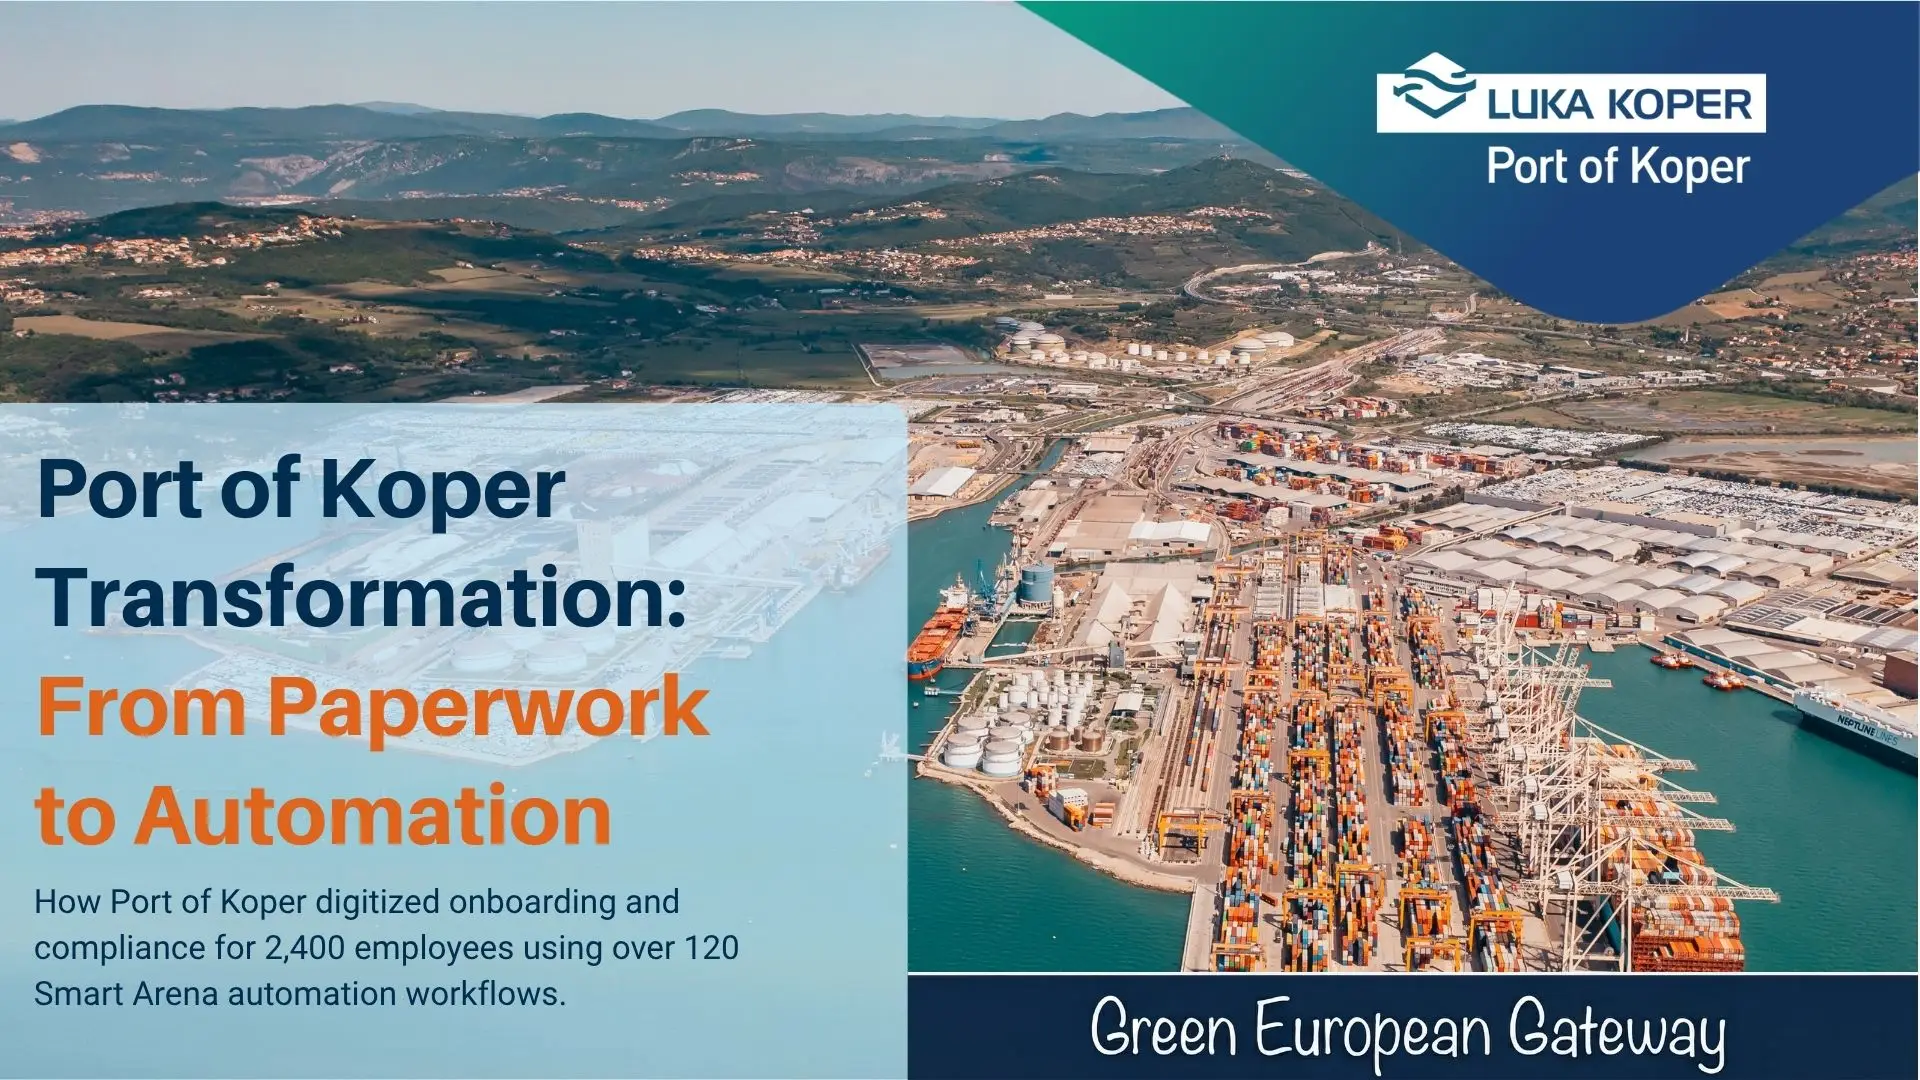
Explore budgeting →“Smart Arena has simplified the management of our e-learning. It connects to our HR system and generates great reports showing who completed what and when.”

Questions, answered.
What can I report on?
Course completions and progress, individual learner engagement, assessment scores, live-session (ILT) participation, and survey results – across every course and format in one platform.
Can I filter and export the data?
Yes. Filter the extended report by course, category, organisation unit, and date range, then export to XLS or CSV. Certificates, assessment results, and survey summaries export on demand, with PDF summaries for leadership.
Do I need a separate analytics or BI tool?
No. Reporting is built into the LMS, so activity is measured where it happens – no data export into a second tool to see results.
Can I build my own custom reports?
Custom report views and scheduled report emails are on the 2026 roadmap for Plus and Premium plans. Today, the extended report with advanced filtering covers most custom needs.